User Behavior in iNaturalist’s City Nature Challenges
At scieneers, social engagement is an important goal that we pursue with value-creating and sustainable projects. We are particularly interested in using our knowledge of data and our technical skills for „data for good“ projects and sharing them with others. The following project from the CorrelAid network aims to investigate the internal dynamics of citizen science communities, in particular how users of such communities behave and what roles they take.
CorrelAid
CorrelAid offers a big network of Data Scientists all around the world, allowing them to work together with non-profit organizations and use their data analysis skills for a good cause. Since such a network goes hand in hand with our aim to actively contribute to non-profit projects with our technical knowledge and our experience , we were very happy to be a part of the international and interdisciplinary team, consisting of Data Scientists and Social Scientists that worked on the following Citizen Science Project.
Citizen Science and iNaturalist
Citizen Science describes a relatively new type of science, where every interested citizen can take part in scientific research. The goal is to produce big databases for certain research fields, by using the power of a big community of interested people all around the world.
This project was conducted with the data of a Citizen Science website, called iNaturalist. iNaturalist is a joint initiative of the California Academy of Sciences and the National Geographic Society. It comes with a mobile application allowing users to record observations of plants and animals around their neighborhood and therefore generating data for biodiversity projects.
In this project, we didn’t look at the data produced by the users, but rather explored the meta-data, meaning user behaviour over four years (2017-2020) and in three different cities: London, San Francisco and Los Angeles. Specifically, we focused on the data coming from the use of iNaturalist during the City Nature Challenge (CNC) events – a spring weekend activity that has started in 2016 and is now global. The data was accessible through the iNaturalist API.
Research Questions
We looked into several aspects of the data using various approaches: general statistical data analysis, network analysis of the communities in each city and geospatial aspects including additional data sources available openly (such as green spaces in the cities). Our research questions revolved around identifying patterns in user behavior and whether there are differences between cities and over time. More specifically, we looked at the attrition of users, classification of users in different sub-groups and we did a geospatial analysis of user behavior.
Exploratory Data Analysis
The analyzed data consisted of the uploaded observations from each user taking part in the CNC in either London, San Francisco or Los Angeles in the years 2017-2020 for the latter two and 2018-2020 for London. We therefore got information about the time and location where an observation was made, which user made it (through the user-ID), the identified species and whether other users confirmed the identification’s label. An initial analysis of the data showed that the number of users per year increased, whereas the number of observations per year stayed roughly the same. This indicates that the average number of observations per user dropped over the years.
Attrition of Users
New User Onboarding
The first user behaviour analysis we did, aimed at finding out how many new users were onboarded per year and city and how their contribution differed from other users. To perform the analysis, we analyzed a cohort of new users, which firstly participated in 2019 and did not participate in the years before. We looked at how many users from those new ones in 2019 did also participate in 2020 and how they made observations. We found out that new users in 2019 made less observations than the average user in 2019, but successfully onboarded users (meaning they participated in the challenge in 2020 as well) made more observations than the average users in 2020.
Attrition dynamics of Users
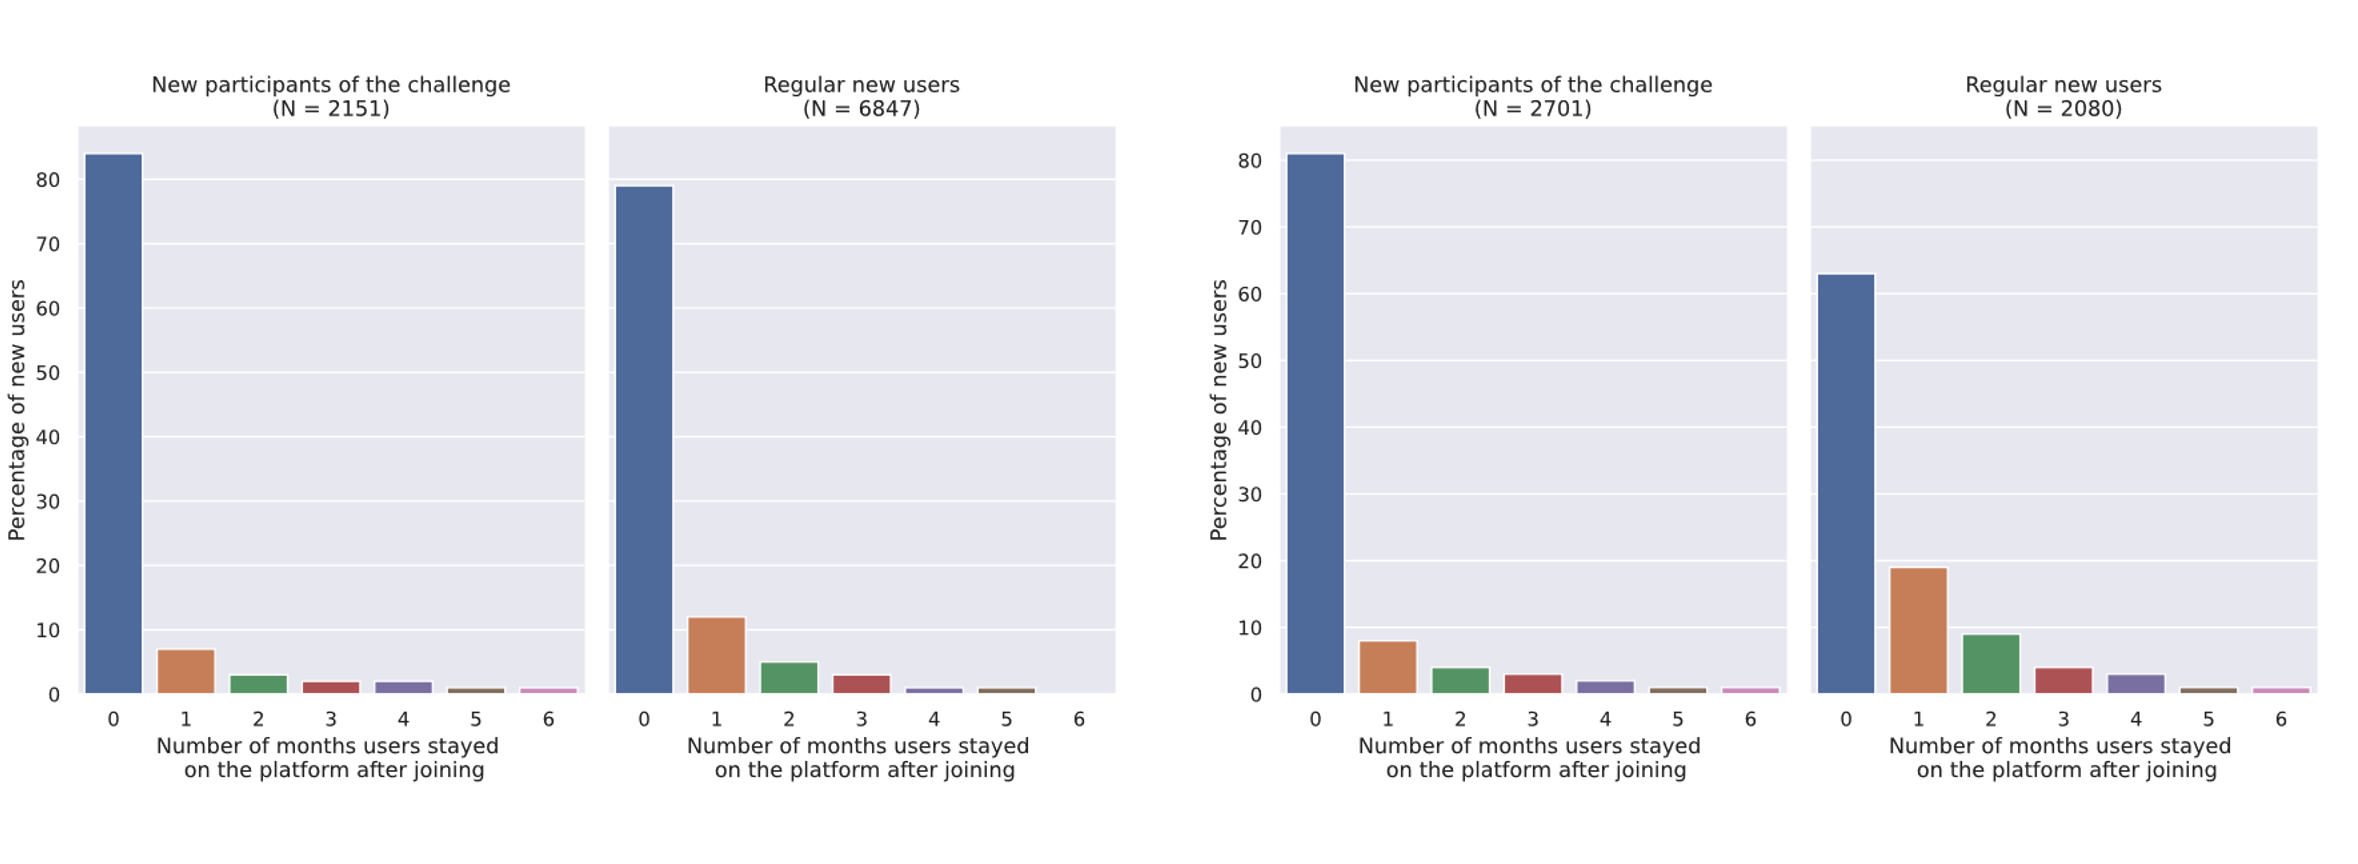
We also looked at the attrition dynamics of users joining the iNaturalist platform for the CNC. We compared those “challenge-users” with “regular users”, meaning users that were already present on the platform before the challenge started. We analyzed the attrition dynamics for San Francisco during 2019 and 2020 and made two interesting observations: first of all, users who joined the platform during the challenge stayed for a rather shorter period of time than users who joined the platform before the challenge. This can be easily explained by the different intrinsic motivations of the participants: “challenge users” are rather coming to the platform to take part in the competition, whereas “regular users” are interested in the platform itself.
Another interesting observation we made was that the attrition dynamics differed substantially between the years 2019 and 2020. More users stayed for up to 6 months on the iNaturalist platform in 2020. This may be correlated to the COVID-19 pandemic, which limited the amount of possible free-time activities.
Classification of Users
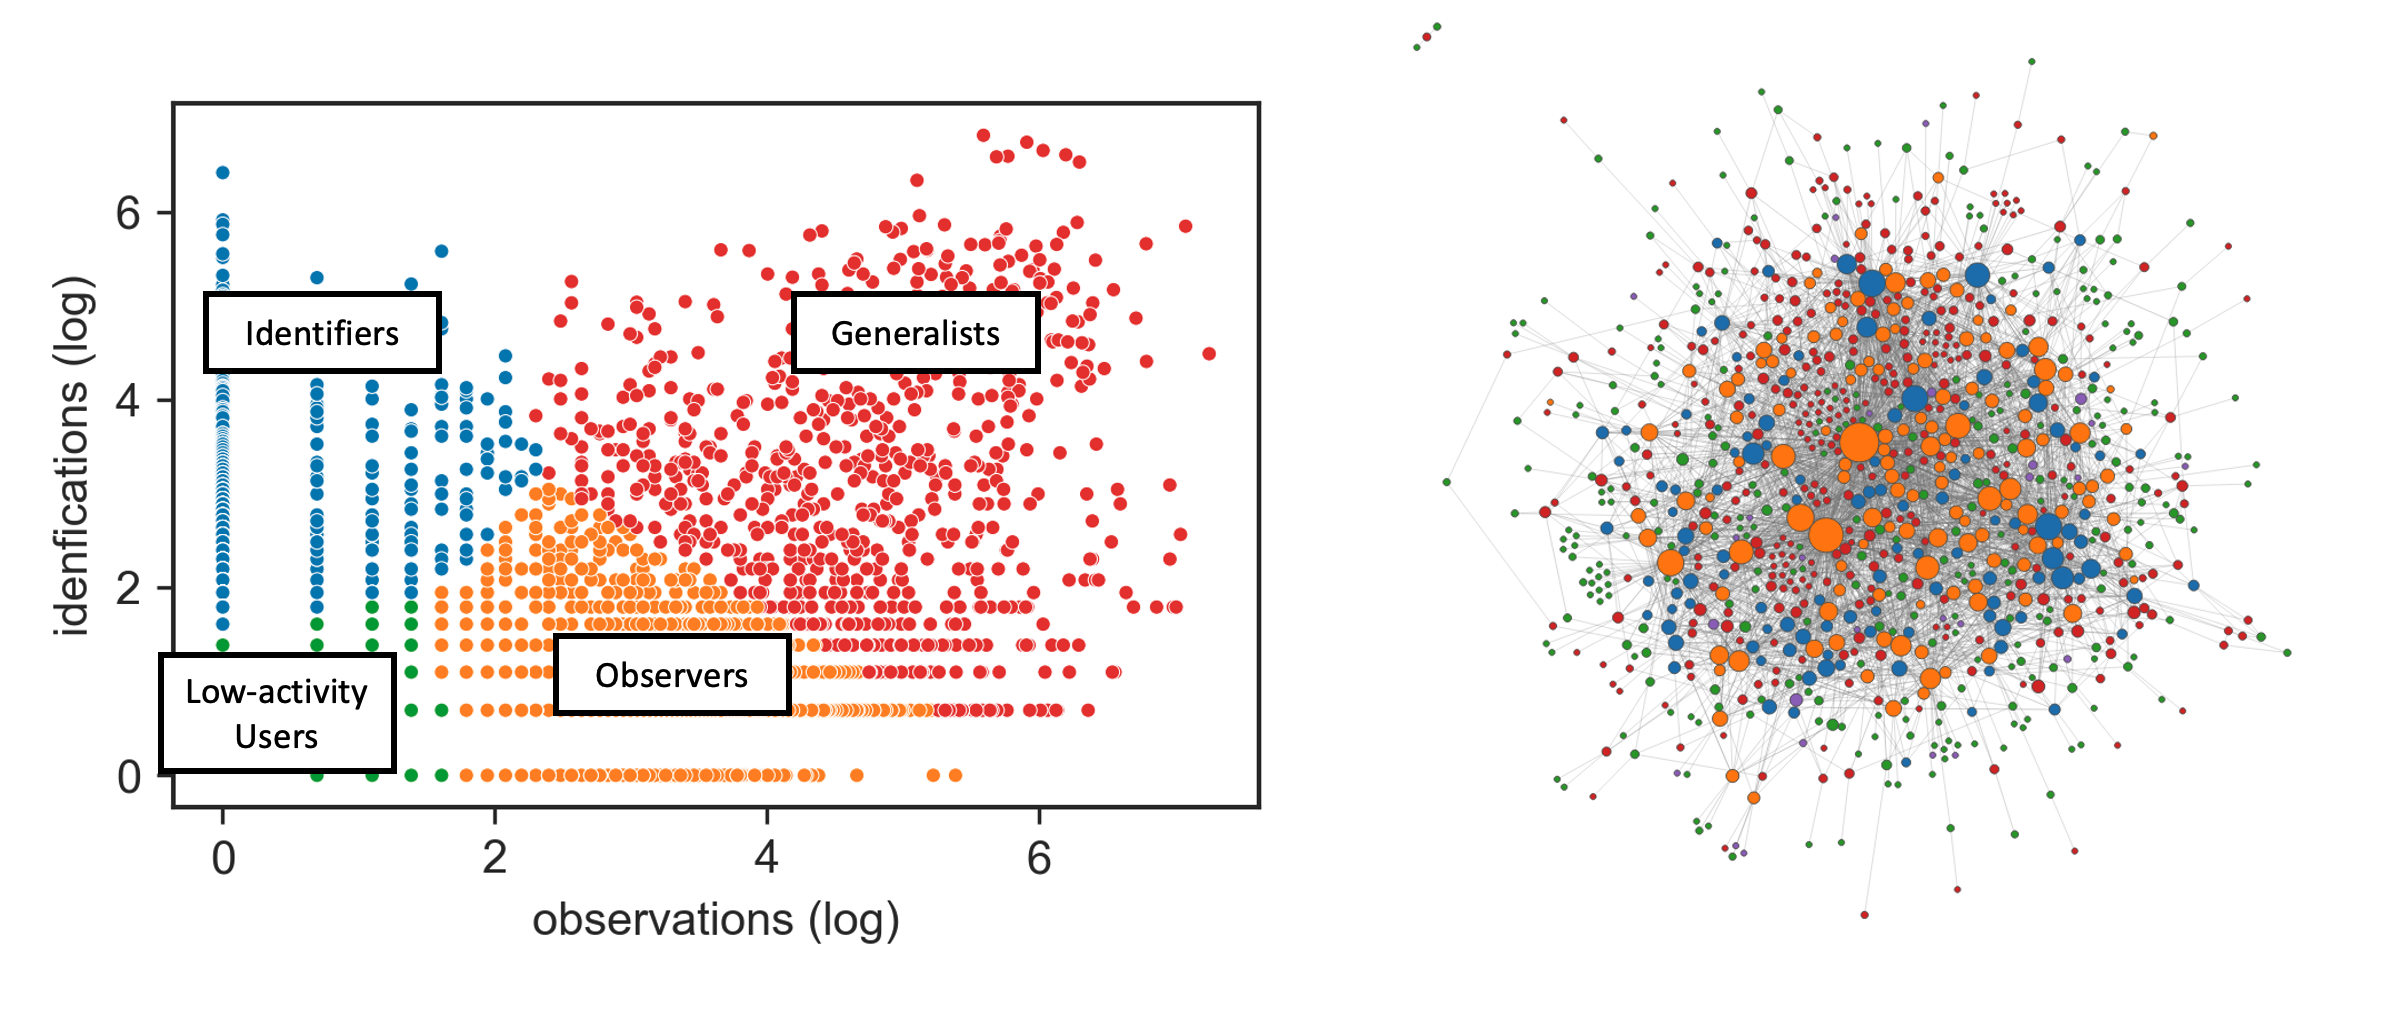
The concept behind the iNaturalist mobile application is the following: users can either make observations, meaning that they upload photos of certain animal species or plants, or they can identify observations made by other users, which can be seen as a labelling task. Based on these two actions, users can be clustered into four different categories based on the number of observations and identifications they made: observers, identifiers, generalists and low-activity users. Generalists are users that perform both tasks equally, whereas low-activity users are mostly users that contribute only once and then disappear from the platform.
We created a social interaction network, where we linked users with each other if they interacted with each other. By analyzing this social interaction network, we found that observers are the most central in the network, meaning that they have many interactions with users of other groups. Additionally, it seems that there are a handful of very active users, mostly observers, and many not so active users, which are part of the other user classes.
Geospatial Analysis
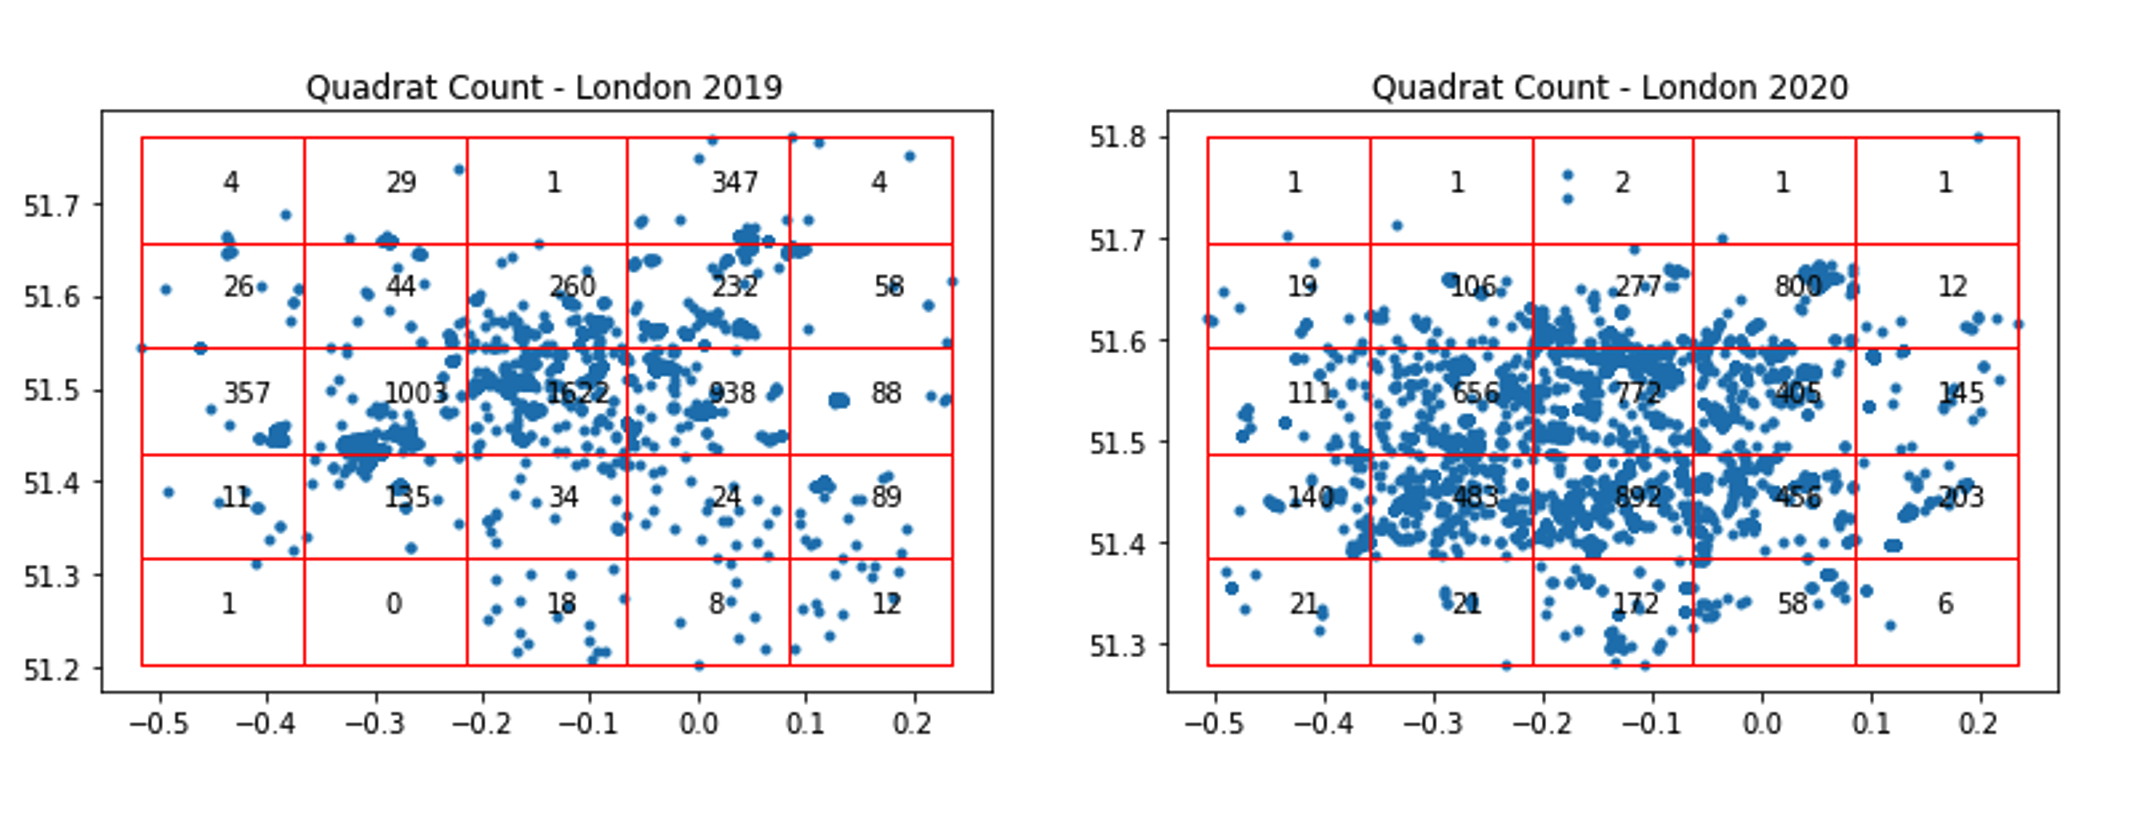
The data we used from the iNaturalist API included information about the location of a user, when the observation was done. We therefore analyzed how the geospatial distribution of users changed over time for the city of London. For the years 2019 and 2020, we found that observations were no longer mainly made in the centre of London, but spreaded towards the borders of the city and the outer regions. This could be related to the COVID-19 pandemic, which did not allow people to be in the city centre, so that users had to search for less visited spots.
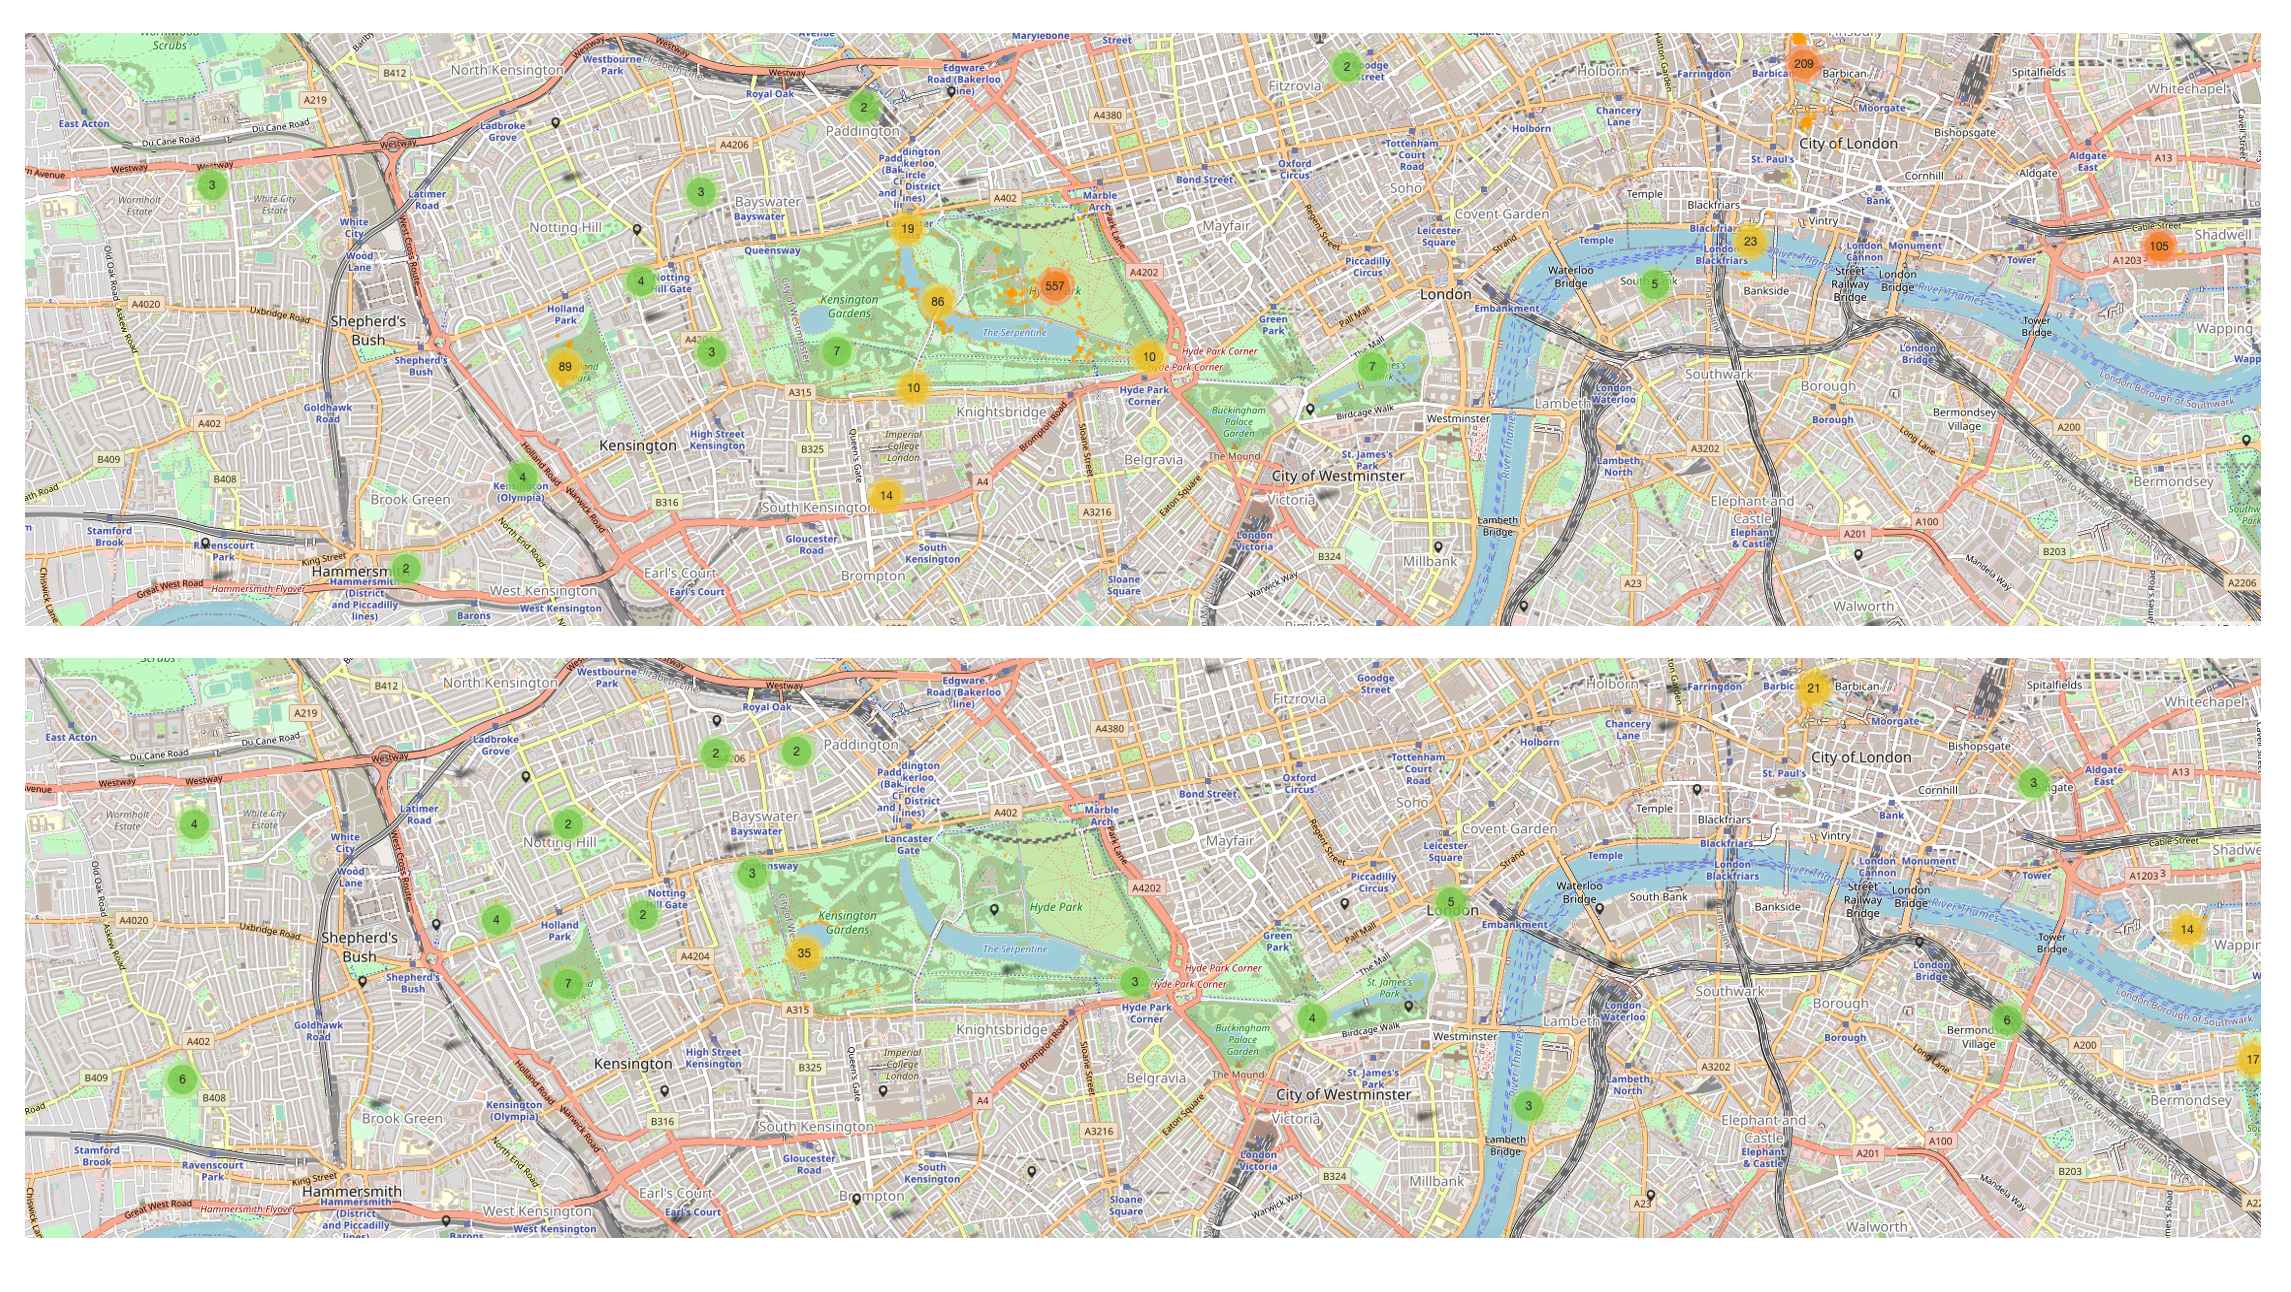
As mentioned above, we did not only use the data coming from the iNaturalist API, but also geospatial data about the nature of the challenge cities, such as data about greenspaces (parks, etc.). We used this additional data to analyze, where in the city users were doing the main part of their observations and whether this behaviour changed over time. To visualize the results, we created interactive maps that show where users did their observations for 2019 and 2020 and all three cities.
When looking at the interactive map for London, one can clearly see that while many observations in 2019 were made in Hyde Park, this was no longer the case in 2020, which is clearly related to the COVID-19 pandemic that came with restrictions concerning the visit of parks.
Last but not least, we looked at the distribution of observations made in greenspaces for the City of London and the years 2018-2020. For this analysis, we introduced a greenspace-flag, which indicates whether an observation was made inside a greenspace (park, etc.) or not. We observed that while in 2018 and 2019 the amount of observations made in greenspaces and the amount of observations not made in greenspace were nearly fifty-fifty, this was definitely not the case for 2020. In 2020, the amount of observations not made in greenspaces grew up to 75%, which is another clear indication of the COVID-19 pandemic restrictions.
We also looked at the greenspace-observation distribution per day of the challenge and were able to observe another interesting phenomenon. During the CNC, there are big events in Hyde Park, which should motivate users to go out and do a lot of observations there. Those events happened on 29.04.2018 and 27.04.2019. When we look at the greenspace-observation distribution on those two days, we can clearly see that there was a huge shift in the amount of observations made in greenspaces compared to the one on the days before and after the event. This clearly shows that such events do motivate people to go outside and make a lot of their observations in parks and other greenspaces around the city. Another interesting observation is that this phenomenon did not occur in 2020, which makes total sense, since during April 2020 the lockdown happened in London, which did not allow the organizers to hold big events in parks.
Summary
With this project we were able to show how users behave on Citizen Science platforms, such as iNaturalist. Even if not intended, we were also able to analyze the impact of the COVID-19 pandemic on the free-time behaviour of people and how they move around the city. This aspect was really interesting, not only for us, but for the organizers of the CNC as well. Our findings allowed them to learn more about their users and to evaluate the effects of planned events on the kind of observations users make. As an outlook, we are planning to continue our analysis for the CNC 2021 and to publish our results as a scientific article, such that the whole Citizen Science community can benefit from our analysis.
Florence López
Data Scientist


